Responding To A Pandemic
Section 3
Direction and Outlook of Education in New Orleans
Direction and Outlook of Education in New Orleans
Is Public Education in New Orleans Improving?
Respondents’ overall opinions about K-12 public education and school quality have increased notably compared to 2019 (though it is important to note that in 2019, we only polled parents of public school students), but were in line with responses from 2018 and 2017. This year, among all respondents, 41% of respondents indicated public education was getting better, 15% said it was getting worse, and 39% said it was staying about the same. In 2019, 23% said better , 27% said worse, and 46% said about the same. In 2018, 39% said better, 15% said worse, and 41% said staying the same. Finally, in 2017, 33% said better, 17% said worse, and 36% said staying the same.
In 2020, the attitudes were comparable across racial and socioeconomic lines. 41% of Black respondents, 44% of White respondents, and 36% of other race respondents said New Orleans education is getting better. 40% of respondents from households making over $75,000 annually and 42% of respondents from households making less than $75,000 annually said education was getting better.
Predictably, non-public school respondents have more negative perceptions about the city’s public education. Only 15% of non-public school respondents said they believed public education in New Orleans was getting better compared to 49% of public school respondents.
When it comes to assigning schools an overall letter grade, respondents also had more positive responses in 2020 than in 2019. Those giving schools a B rose from 11% in 2019 to 32% this year. The percentage giving schools an A doubled from 3% to 6%, while the C grades remained consistent from 47% last year to 45% this year. But notably, in 2019, 34% of public school parents gave the schools a D or an F. This year, that fell to 16%. The percentage of respondents giving schools a B was higher than at any point over the past four years. This held true across racial lines. Once again, non-public school respondents were more negative than public school respondents about public education in New Orleans. 19% of non-public school respondents gave the school system an A or B compared to 42% of public school respondents.
NOLA-PS
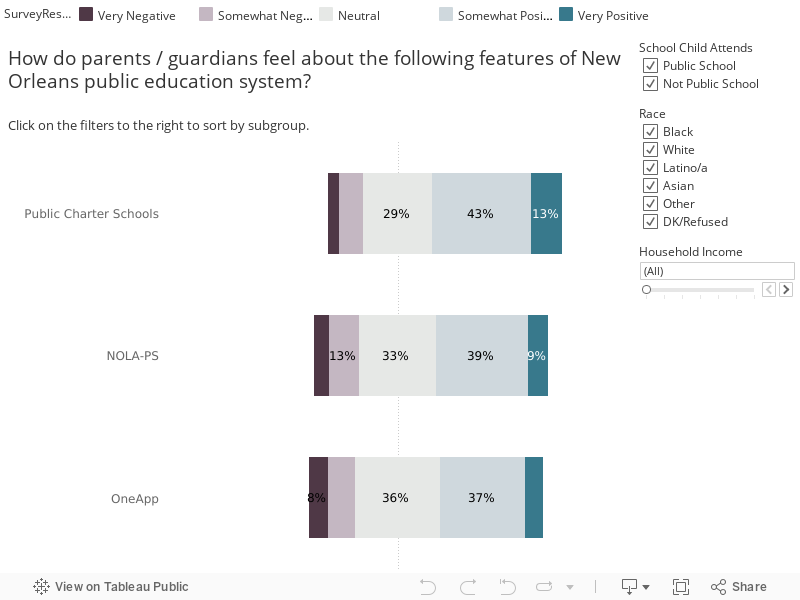
Respondents’ opinions of the district, NOLA-PS, also grew more positive in 2020. All respondents were asked to rate “New Orleans Public Schools, the body that oversees and authorizes New Orleans’ public charter schools.” Overall, 44% of respondents had a very or somewhat positive response and 18% of respondents provided a very or somewhat negative rating. In 2019, when we asked respondents about the Orleans Parish School Board (NOLA-PS’ previous name), just 19% had positive responses compared to 31% who had negative ones. In addition, 51% of respondents with at least one child enrolled in a public school said they felt positive or very positive about NOLA-PS compared to 18% of respondents with no children enrolled in a public school.
We also asked respondents with at least one child enrolled in a public school if they believed believe that NOLA-PS should have the authority to exert strong governance over the city’s autonomous charter schools. 58% of respondents either strongly agreed or agreed with the idea that NOLA-PS should be able to close or turn over underperforming schools to another operator, compared to 20% who disagreed or strongly disagreed. In 2019, 56% agreed or strongly agreed, showing consistency across these two years. The subgroups with the highest rates of support for that authority were respondents from households earning more than $75,000 annually (78%) and those who hold a bachelor's degree or higher (69%).
Public Charter Schools
Overall approval for public charter schools was higher in 2020 than in 2019. In 2020, 54% of all respondents felt either very or somewhat positive about public charter schools in the city, compared with just 15% that felt somewhat or very negative. Last year, a total of 35% of respondents felt neutral about public charter schools, compared to 30% who felt positively and 29% who felt negatively.
The difference between last year and this year was noticeably different among public school respondents. In 2019, 30% of public school respondents felt positively about public charter schools, and 29% held explicitly negative views. This year, 61% of public school respondents felt positively about the city’s public charter schools, compared to 11% who felt negatively.
White respondents were slightly more likely to hold positive opinions of the city’s public charter schools than Black respondents, with 56% of White respondents feeling somewhat or very positive about public charter schools compared to 51% of Black respondents.
Additionally, a majority (56%) of all respondents agreed that public charter schools have improved public education in New Orleans, while 24% disagreed. This was an increase from 2019, when 49% agreed they’d improved schools and 37% disagreed. However, opinions were similar to 2018, where 61% agreed charters improved schools and 17% disagreed, and to 2017, where 64% agreed charters improved schools and 15% disagreed.
Attitudes towards the impact of charter schools on the city’s public education system varied slightly along socioeconomic and racial lines. Respondents from households making more than $75,000 were more likely to think that education was improving than those from households making less than $30,000 (66% and 38%, respectively). Moreover, Black respondents were more likely to disagree with the statement that public schools have improved education in New Orleans (26%) than White respondents (21%).
OneApp
While a majority of respondents did not have positive views of OneApp, sentiment about the enrollment system was more positive than in 2019. Of the public school respondents polled this year, 41% felt either very or somewhat positive about OneApp compared to 18% who felt somewhat or very negative. In 2019, 19% felt positively and 25% felt negatively. In addition, 26% of respondents reported they have concerns about OneApp. Of the respondents who reported concerns, 30% said it was because they didn’t get the school of their choice. Another 16% said they didn’t get a school close to home, while 12% said there were not enough good schools, and 12% had problems with the process itself, saying it was difficult to use. Concern about OneApp varied along socioeconomic lines. 41% of respondents with household incomes under $30,000 stated that they have concerns about OneApp and only 16% of respondents from households with incomes above $75,000 stated they have concerns about OneApp. Finally, 67% of respondents said they agreed or strongly agreed that OneApp won’t work the way it is intended to until there are more quality schools in the city. This was a 6% increase from 2019.
Transportation
COVID-19 has also affected the way public school respondents’ children get to school each day. 50% of all parents said that prior to the pandemic, their children took the bus most days. Following the onset of COVID, only 42% of parents said their child(ren) were taking the bus. The number who said they were driving their kids to school rose from 47% to 52% as well. As in our polling about transportation in 2019, there were notable differences in transportation access across race and socioeconomic lines. White respondents (59%) were more likely to drive their children to school after the onset of COVID-19 than Black respondents (44%). Respondents from households making under $75,000 annually were less likely to drive their children to school (46%) after the onset of COVID-19 than respondents from households making over $75,000 annually (76%). Respondents from households making less than $30,000 annually (31%) were the least likely to drive their children to school after the onset of COVID-19.